
The Population Recession: Economic and Geopolitical Consequences of Population Decline
Introduction
In an era marked by environmental challenges and concerns about sustainability, the topic of overpopulation frequently takes center stage. The prevailing narrative suggests that the world’s population is on an unending upward trajectory, with more and more people crowding into an already strained planet. But is this narrative accurate?
The reality may be more complex than it first appears. While it’s true that the global population has been growing, this trend is not uniform across all regions. In fact, in some parts of the world, such as Europe, the United States and some countries in Asia, we may be on the cusp of a demographic shift towards population decrease.
In this article, we will delve into this less-explored aspect of demographic trends and its consequences. We’ll examine a range of indicators that suggest a potential shift towards decreasing populations in Europe and the USA. These include the changing shape of age pyramids, the rise in death rates, the decline in birth and fertility rates, and the increasing rates of involuntary childlessness. Understanding these causes is crucial for imagining a future with a decreasing population.
The impacts of such a decline could be far-reaching, affecting our economies, societies, and geopolitical landscapes in ways we are only beginning to understand. From labor shortages and decreased productivity to changes in social structures, family structures, and cultural norms, a declining population will require societies to find ways to adapt to these changes. Furthermore, a declining population could have significant geopolitical consequences, potentially shifting the global balance of power and influencing international policies and diplomacy.
Join us as we explore these trends, consider their potential economic, sociocultural and geopolitical impacts, and imagine a future where population decrease, rather than increase, becomes the new norm.
Some Indices and Their Significance
To understand the potential shift towards population decrease, we need to delve into a range of demographic indices. These indices, or indicators, provide a snapshot of the current state of our population and offer clues about future trends. Let’s take a closer look at some of these key indices.
Age Pyramids
Age pyramids, also known as population pyramids, are graphical representations of the age and sex distribution of a population. Traditionally, these pyramids have a wide base and narrow top, reflecting a large number of young people and a smaller number of elderly. However, this shape is changing.
In the USA, the population pyramid has been becoming more columnar over the past two decades. In 2000, the pyramid had a broad base, indicative of a large young population. By 2020, the base had narrowed significantly, suggesting a decrease in the proportion of young people.
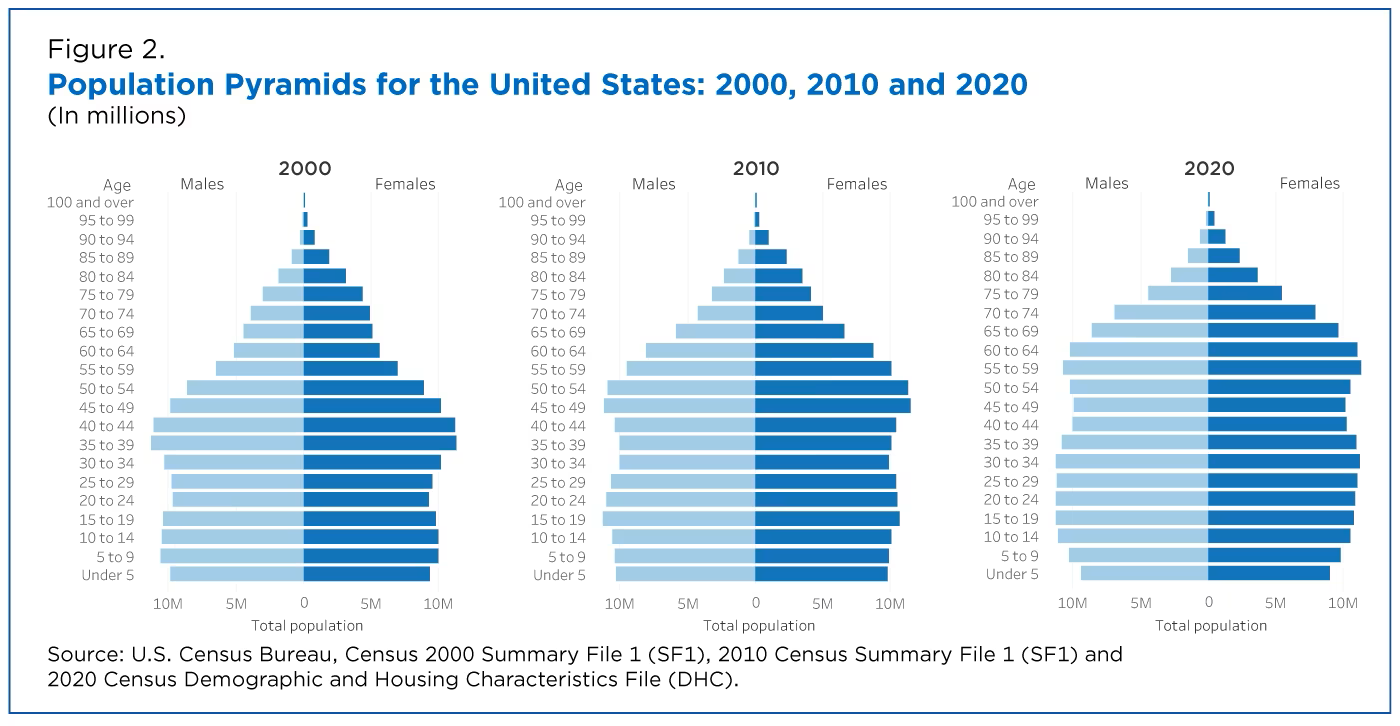 Population pyramids for the United States: 2000, 2010 and 2020 (in millions). Source: US Census Bureau
The situation in the EU-27 is even more striking. The 2019 population pyramid shows a thin base and top, with the largest age cohorts between 30 and 60. This suggests a low number of children and elderly people. Projections for 2050 show a top-heavy pyramid with a thin base, indicating a larger aging population and fewer young people.
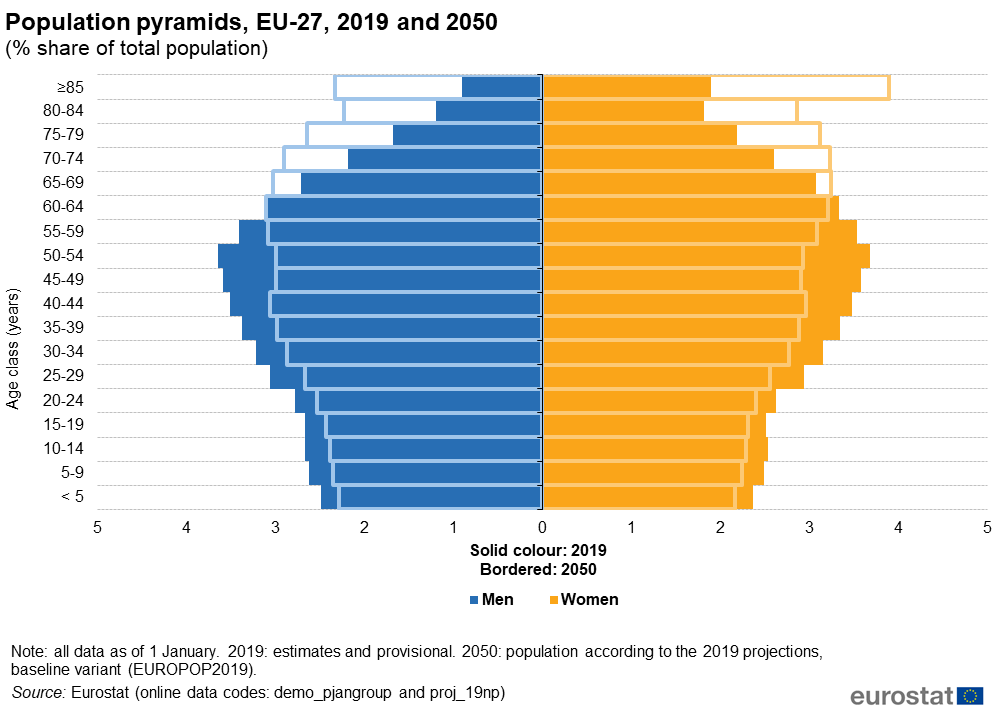 Population pyramids, EU-27 for 2019 and 2050. Source Eurostat
Why is this important? A top-heavy pyramid suggests a society with more elderly people who require support and fewer young people to provide that support, both in terms of direct care and economic contribution. This demographic shift could have significant implications for social security systems, healthcare, and the economy.
Crude Birth and Death Rates
Crude birth and death rates are basic measures of population change. The crude birth rate is the number of births over a given period divided by the person-years lived by the population over that period. The crude death rate is calculated similarly.
Data from the EU and the USA from 1960 to 2021 shows some interesting trends. In the EU, the death rate surpassed the birth rate around 2011. In the USA, the birth and death rates are about equal. This suggests that these regions are not adding as many new individuals to the population as they are losing to death.
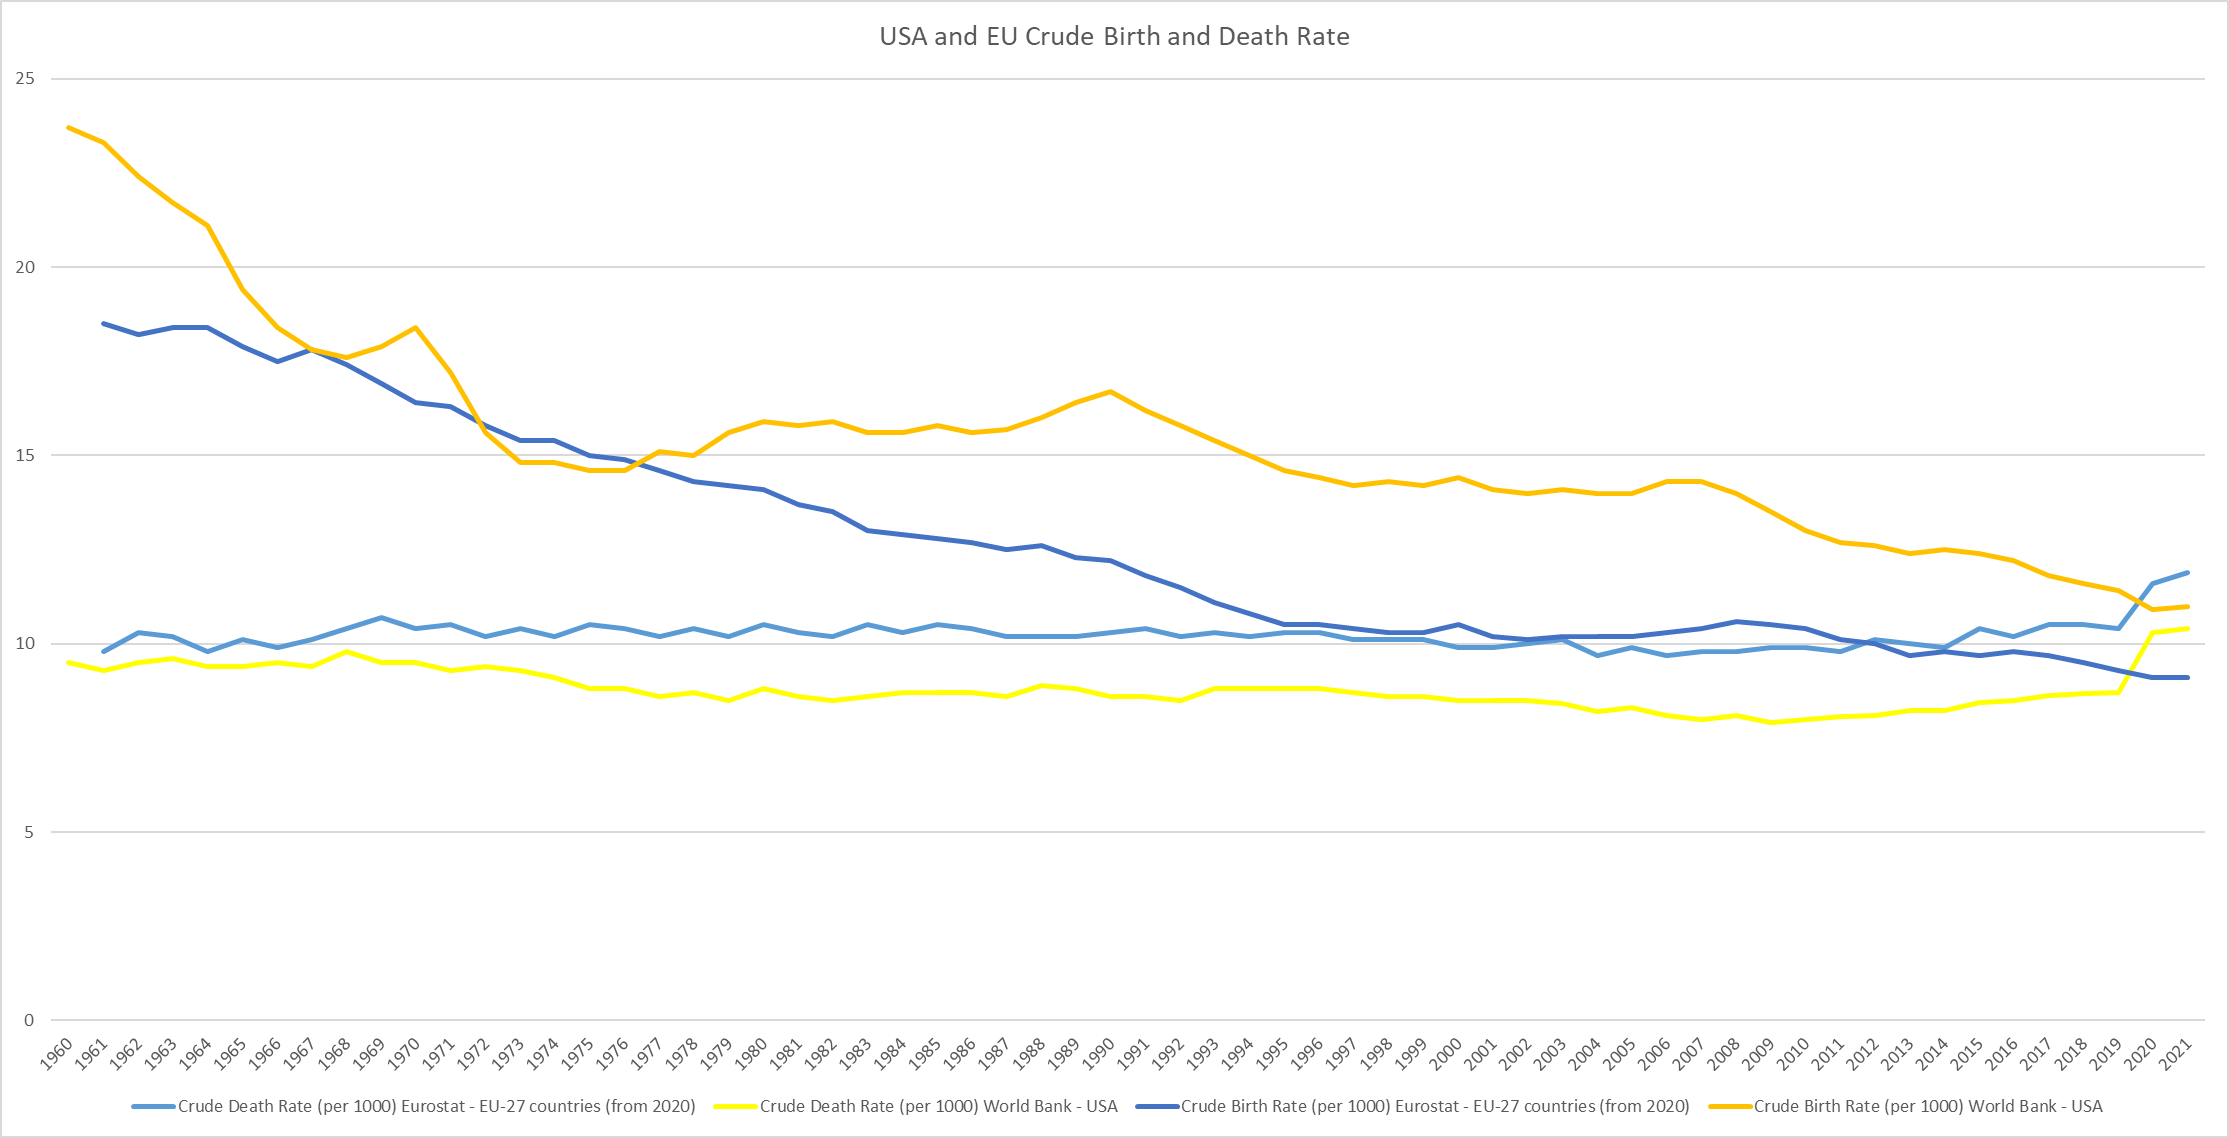 USA and EU Crude Birth and Death Rates. Source: World Bank and Eurostat
Fertility Rates
Fertility rates provide another lens through which to view population trends. The fertility rate is the average number of children a woman would have assuming that current age-specific birth rates remain constant throughout her childbearing years.
In both the EU and the USA, fertility rates have been declining and are currently well below the replacement rate of 2.1 children per woman. The EU is at about 1.5, and the USA at about 1.7. This means that, on average, women are having fewer children than needed to replace the current population.
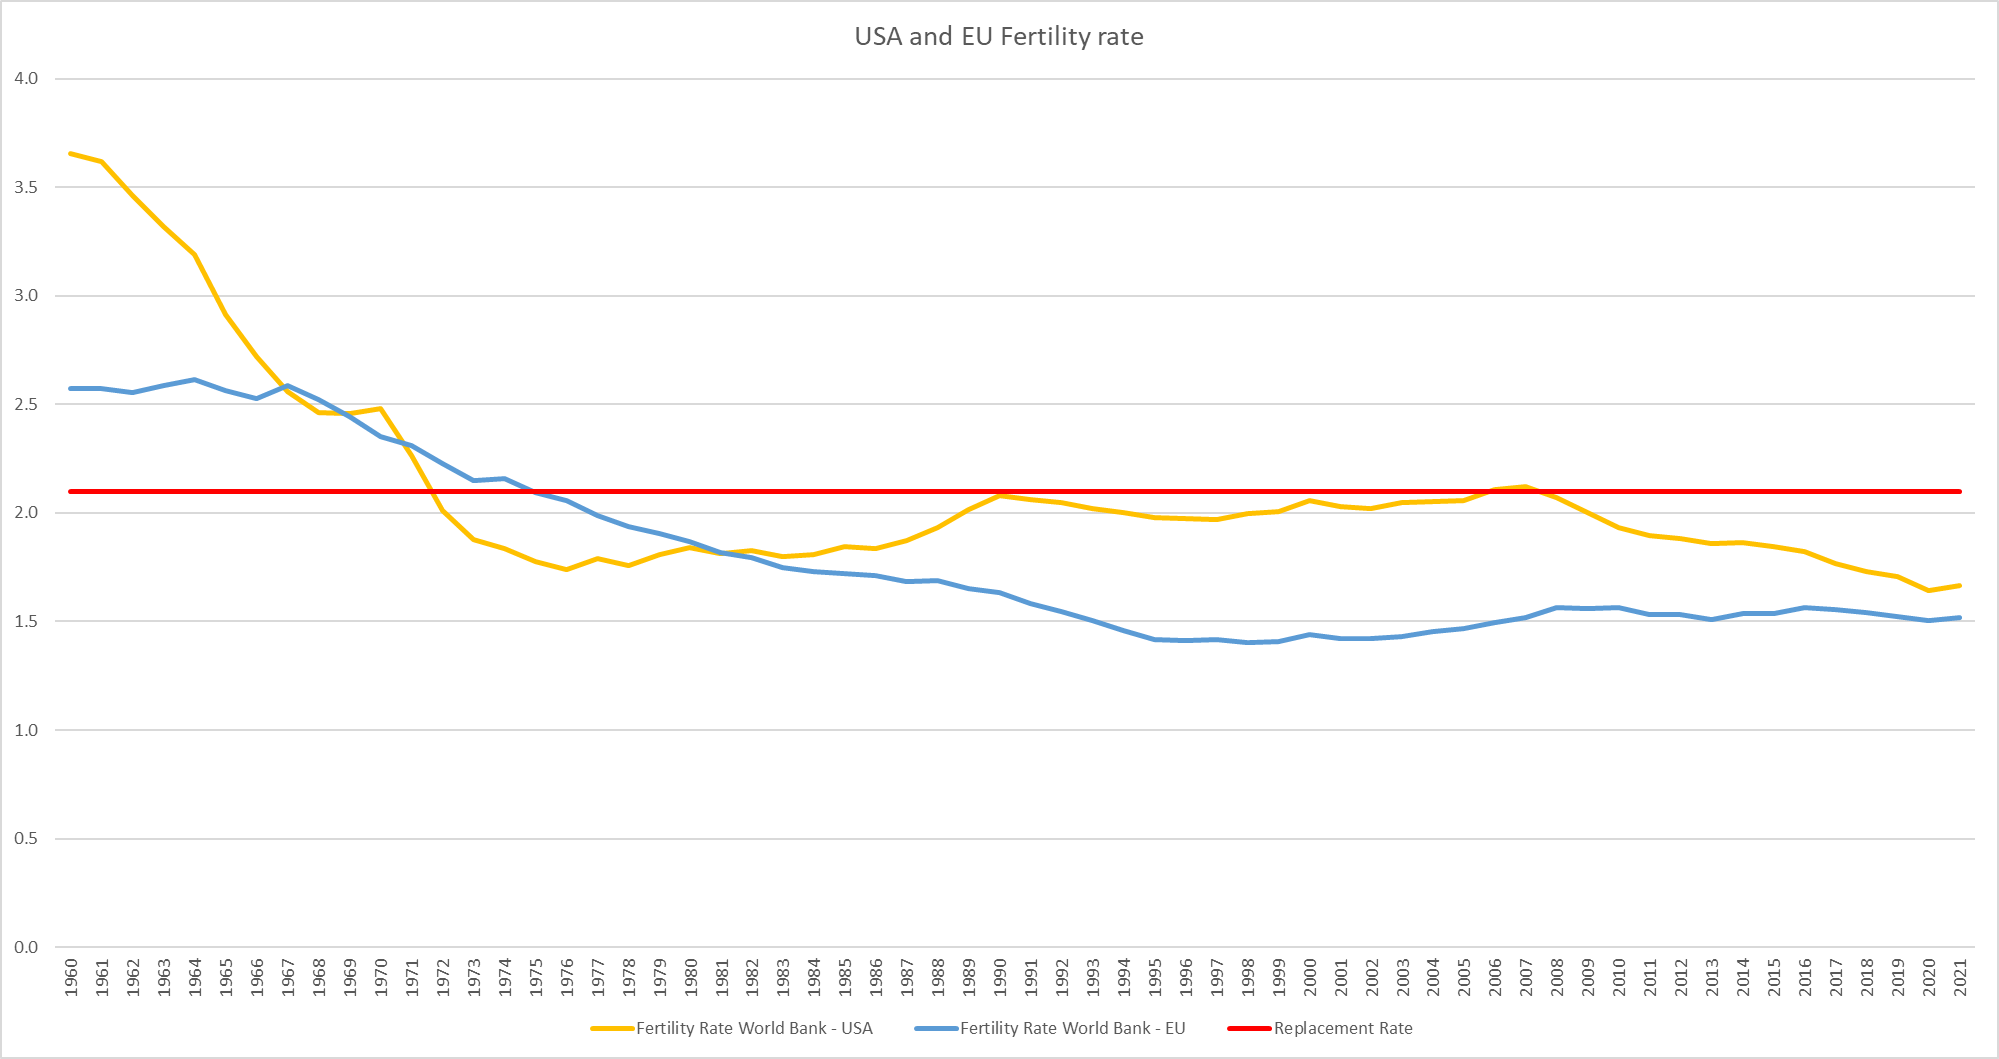 USA and EU Crude Fertility Rates with replacement rate of 2.1. Source: World Bank
How fertility rates impact a population
To understand what these fertility rates mean for a population, consider the following example. Let’s imagine a scenario without mortality, immigration, or emigration. In this example, each woman in the first generation has children equal to the average fertility rate. For instance, in a population of 1000 individuals, with half male and half female, and a fertility rate of two, the next generation will also have 1000 individuals because each woman has two children.
| Fertility Rate | Gen 0 | Gen 1 | Gen 2 | Gen 3 | Gen 4 | Gen 5 |
|---|---|---|---|---|---|---|
| 2.1 | 1000 | 1050 | 1102.5 | 1157.6 | 1215.5 | 1276.3 |
| 2.0 | 1000 | 1000 | 1000 | 1000 | 1000 | 1000 |
| 1.9 | 1000 | 950 | 902.5 | 857.4 | 814.5 | 773.8 |
| 1.8 | 1000 | 900 | 810 | 729 | 656.1 | 590.5 |
| 1.7 | 1000 | 850 | 722.5 | 614.1 | 522.0 | 443.7 |
| 1.6 | 1000 | 800 | 640 | 512 | 409.6 | 327.7 |
| 1.5 | 1000 | 750 | 562.5 | 421.9 | 316.4 | 237.3 |
| 1.0 | 1000 | 500 | 250 | 125 | 62.5 | 31.3 |
| 0.6 | 1000 | 300 | 90 | 27 | 8.1 | 2.4 |
Table showing the population size of successive generations for different fertility rates, starting at a population size of 1000, ignoring mortality and migration.
This table shows the population size for each generation (from 0 to 5) for different fertility rates. As shown, the population size decreases with each successive generation when the fertility rate is below the replacement rate of 2.0. The decrease is more pronounced for lower fertility rates.
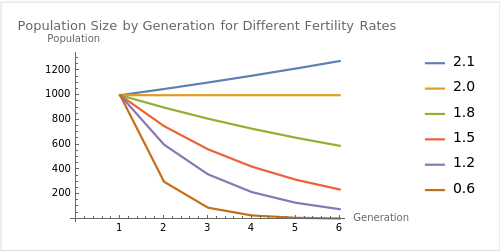 Graph showing the population size of successive generations for different fertility rates.
This visual representation provides insight into the challenges that the EU and the USA are facing, with current fertility rates of 1.5 and 1.7, respectively. It points towards a significant population decline towards the end of this century.
Household Structure
Changes in household structure can also provide insights into demographic trends. In the Euro area, the percentage of households with no children increased from 72.55% in 2006 to 76.41% in 2022.
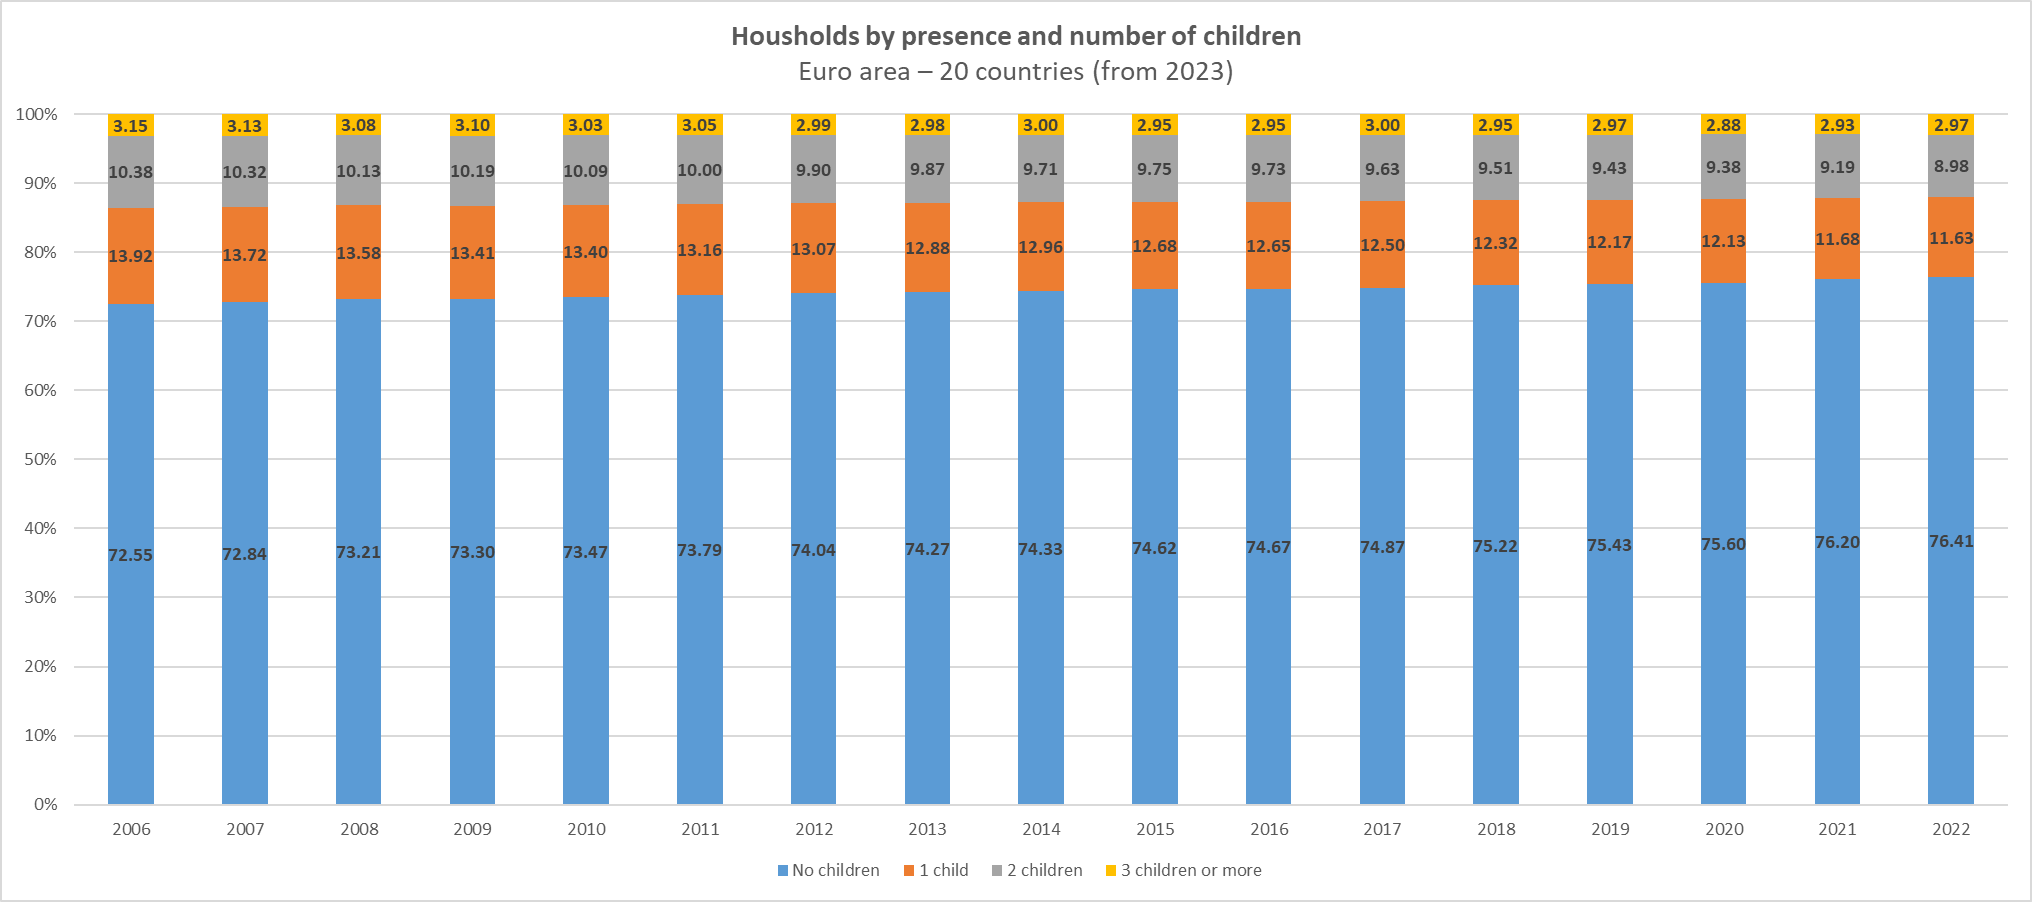 Graph showing European households in 20 countries by presence and number of children. Source: eurostat
In the USA, the distribution of households by type has also shifted. One-person households grew from 13% of the total in 1960 to 28% in 2015. Households with couples and children decreased from 43% in 1960 to 24% in 2015.
 Graph showing United States household composition. Source: UN statistics
Childlessness
Finally, rates of childlessness provide another key piece of the demographic puzzle. Across a range of countries, there is a trend towards excess childlessness. In most countries, about 5% of women do not desire children at age 25-29, whereas about 20% do not have children by age 40-42. This gap is largest among highly educated women.
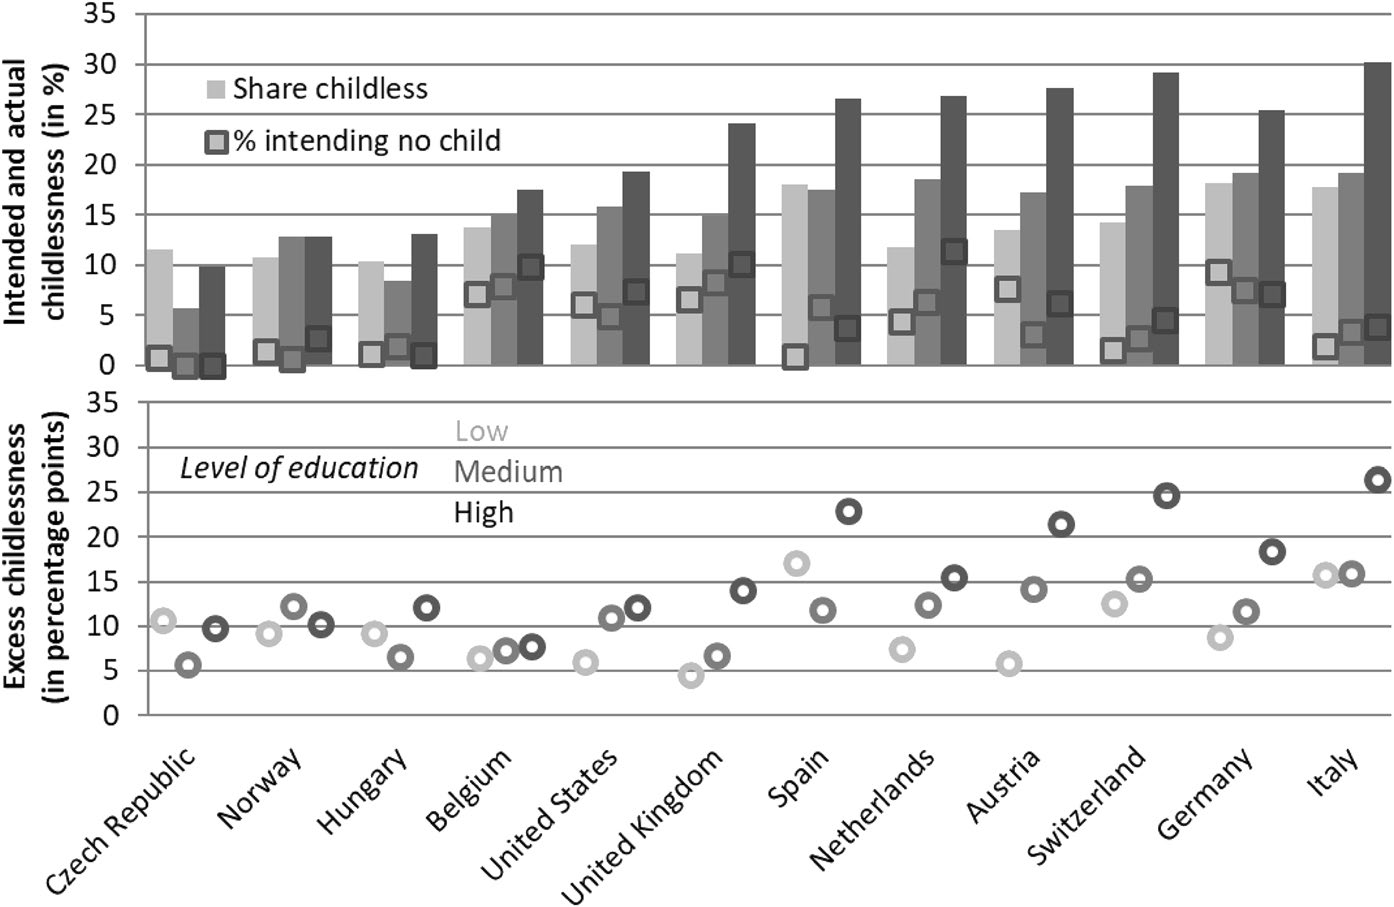 Share of women intending not to have children at age 25–29, share not having children at age 40–42. Source: Beaujouan & Berghammer (2019)
Causes of population decline
The demographic trends we’ve discussed are not occurring in a vacuum. They are the result of a complex interplay of factors, including societal changes, economic conditions, and personal choices.
Declining Birth Rates and Fertility Rates
One of the primary drivers of population decline is falling birth rates. This is closely tied to declining fertility rates. Advances in education and career opportunities for women have led many to delay childbearing or forego it altogether. In fact, the increasing rate of childlessness is the main contributor towards the decrease in fertility rate. The cost of raising children, particularly in urban areas, is another significant factor.
Increasing Rates of Childlessness
The increasing rates of childlessness we’ve observed are also contributing to population decline. Societal changes, such as shifting attitudes towards family and parenthood, have played a role. Economic factors like the rising cost of living and the perceived financial burden of raising children can deter people from starting families.
Aging Population and Rising Death Rates
Another key factor in population decline is the aging of the population. As medical advances increase life expectancy, the proportion of elderly people in the population rises. This can lead to a situation where the death rate surpasses the birth rate, as seen in the EU.
Consequences of Population Collapse
Economic Impact
Labor Market and Productivity: A shrinking population could lead to a reduction in the size of the workforce, potentially leading to labor shortages. In the long term, it could lead to decreased productivity and economic output.
Public Finances: With fewer workers contributing to tax revenues and more elderly people drawing on public services, the fiscal burden on governments could increase significantly.
Investment and Interest Rates: A declining population could lead to lower demand for goods and services, which could in turn reduce the incentive for businesses to invest. This dynamic could lead to lower interest rates, but also challenges such as asset price bubbles and a potential housing market collapse.
Global Economic Balance: As the population and economic power of Western countries decline relative to rising powers in Asia and Africa, we could see a shift in the global economic order.
Societal and Cultural Effects
Social Structures and Institutions: Fewer young people could lead to decreased enrollment in schools and universities, potentially leading to closures. An aging population puts pressure on healthcare systems.
Family Structures and Caregiving: Smaller family sizes could lead to fewer siblings and extended family members, impacting social support networks. The burden of caregiving could increase for younger generations, potentially leading to a “care crisis”.
Culture and Social Cohesion: Societies might become more adult-centric. If population decline is uneven across social groups, it could lead to increased social tension. A gain in stagnantness and loss of dynamism may occur as the proportion of young, creative, and risk-taking individuals decreases.
Geopolitical Consequences
Shift in Global Power Dynamics: Emerging economies with younger and growing populations could gain increased influence.
Military and Defense: A smaller population could mean a smaller pool for military service, impacting a country’s ability to project power.
International Policies and Diplomacy: Western influence in international institutions could diminish, potentially leading to shifts in global norms and rules.
Migration: A declining population could lead to increased demand for immigrant labor, potentially leading to changes in border policies and increased cultural diversity but also social tension.